It’s a while since I’ve posted about new papers, so I’m going to have a series of posts catching up on 2022’s papers. First up is Jens Lallensack’s cool paper in Interface about using AI and machine learning to distinguish between theropod and ornithopod tracks.
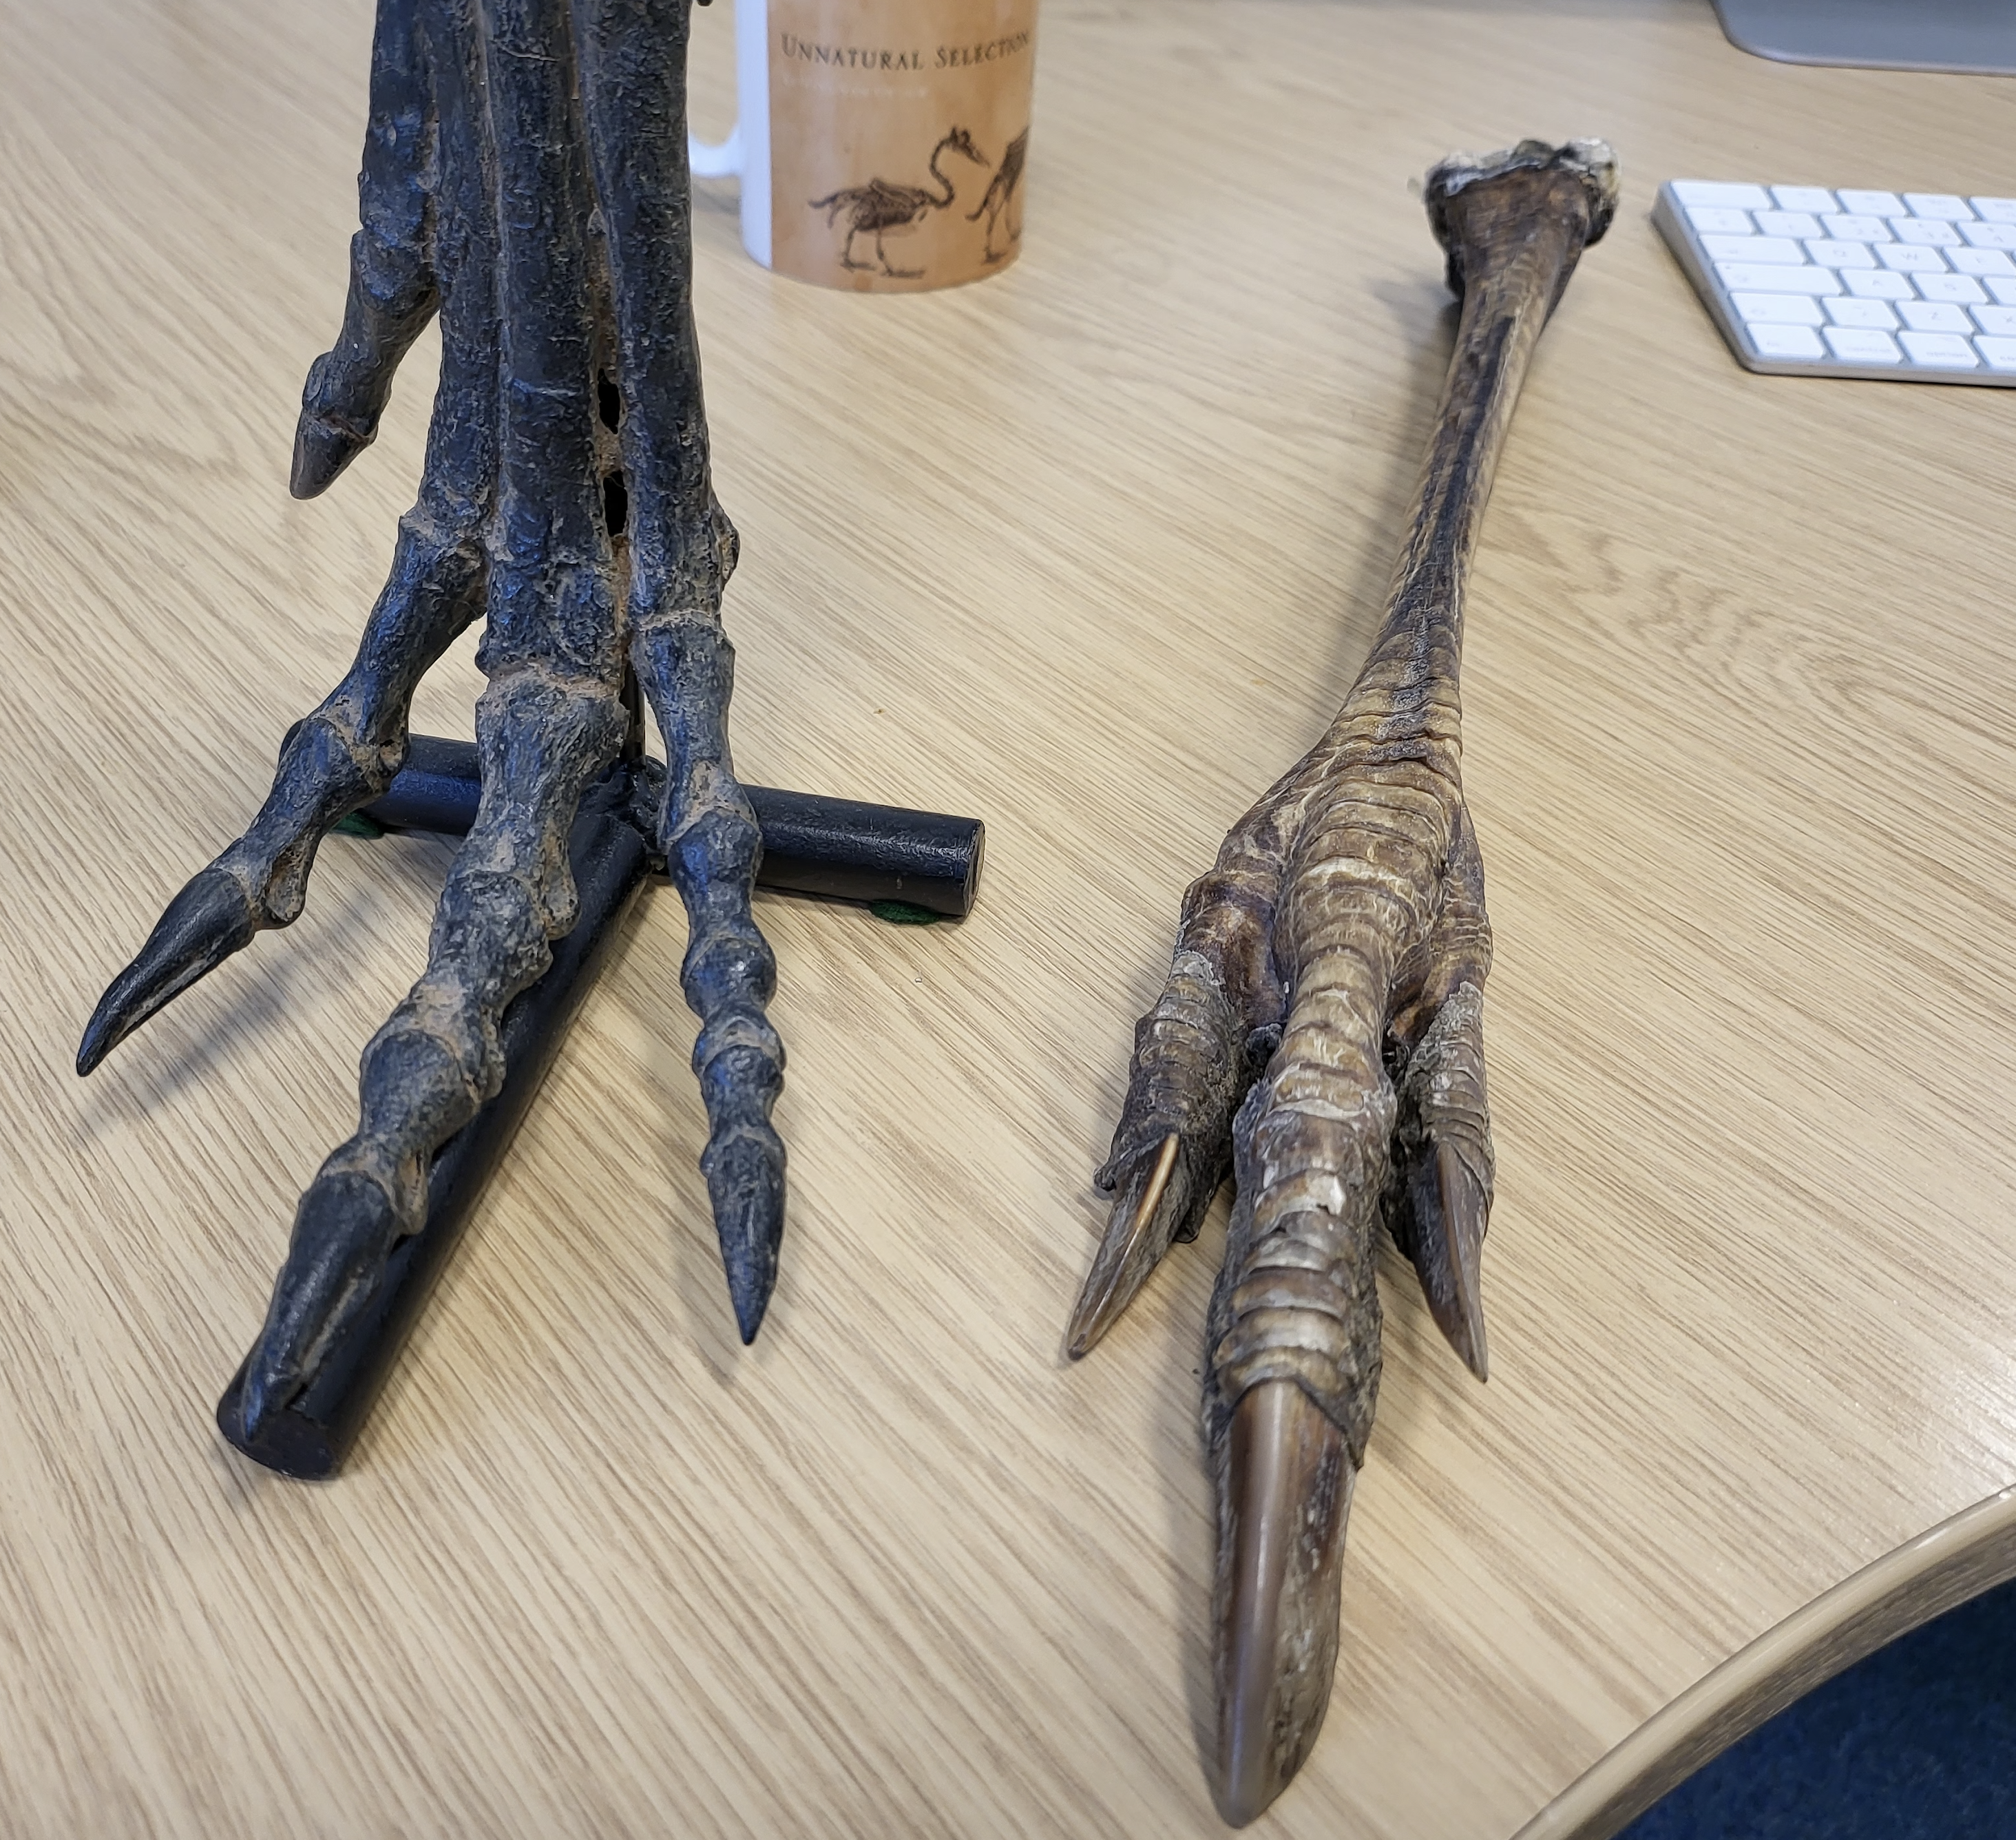
For those unfamiliar, ornithopod tracks and theropod tracks are both tridactyl, or three-toed. Ornithopods include things like Hadrosaurs, and are all plant eaters, while theropods include all the famous meat-eaters as well as a bunch of herbivores. As a general rule of thumb, theropod tracks are more slender, and pointier. But there’s lots of exceptions to this; small ornithopods can be quite gracile, and big theropods, like T. rex, can have quite chunky feet. And while Ornithopod trackways sometimes preserve both manus and pes prints, often it’s just the hind feet that leave traces.
In fact, it’s really hard to narrow down exactly what makes a theropod track a theropod track, and an ornithopod track an ornithopod track. Ichnologists will often use context to help – what dinosaur bones are known from the area where the footprints are found, for instance, or how old are the rocks?
Enter former post-doc Dr Jens Lallensack, who got excited about the use of machine learning to try and discriminate between ornithopod and theropod tracks.
Now, I’ve made a big song and dance in the past about everyone collecting 3D data of tracks, and Jens among many others are definitely on side with that (though frustratingly, some recent papers seem to be getting published without bothering with this, despite authors, editors, and reviewers, that should know better /rant). In an ideal world, that 3D data would provide a wealth of information to work with – maybe even too much (conflating sedimentary collapse, or variations due to locomotion etc). However, it’s a moot point, because machine learning algorithms require a metric crap tonne of data to train on. And as most of the ichnological literature pre-dates modern digitization techniques, the vast majority of documented dinosaur tracks are two dimensional silhouettes or outlines.
As such, to create a big enough training dataset, Jens went through the literature and re-drew 677 ornithiscian tracks, and 959 theropod tracks, and converted them into 2D black-white silhouettes all 100 x 100 pixels. That sounds low res, which it certainly is – the outlines we used look quite blocky, but this actually got rid of an awful lot of noise. Now, this data training set is based on ichnologists interpretations – whether something was deemed ornithopod or theropod was based on what ichnologists had determined in the literature, and mistakes do get made (and sometimes tracks are ambiguous, as we’ll come to later).
That’s over 1600 track outlines Jens drew! He then used a portion of this to train a model using TensorFlow, and reserved some to see how good the model was on novel tracks. To add some spice to this, we also gave the outlines to 5 experts (the two co-authors including myself, plus 3 other ichnologists I won’t name here, but they are acknowledged in our paper) to classify as theropod, ornithopod, or don’t know.
I was expert 1 in the paper, and while I’m happy I had the highest % correct out of all the experts, I also had the highest incorrect %, with fewest don’t knows. But it doesn’t really matter who did best (or worst!), because the neural network absolutely trounced all of us, getting 86% correct if not allowed ‘don’t know’, and 67% correct if we treated middling values as ‘don’t know’. For comparison, I hit a 67% correct rate, but with 31% incorrect, vs just 11% incorrect for the neural network with don’t knows, and 14% without.
So that’s promising – without any of the context (age, stratigraphy, known fossils etc), the neural network was already out-performing several experts.
Now to put it to the test against some ambiguous tracks.
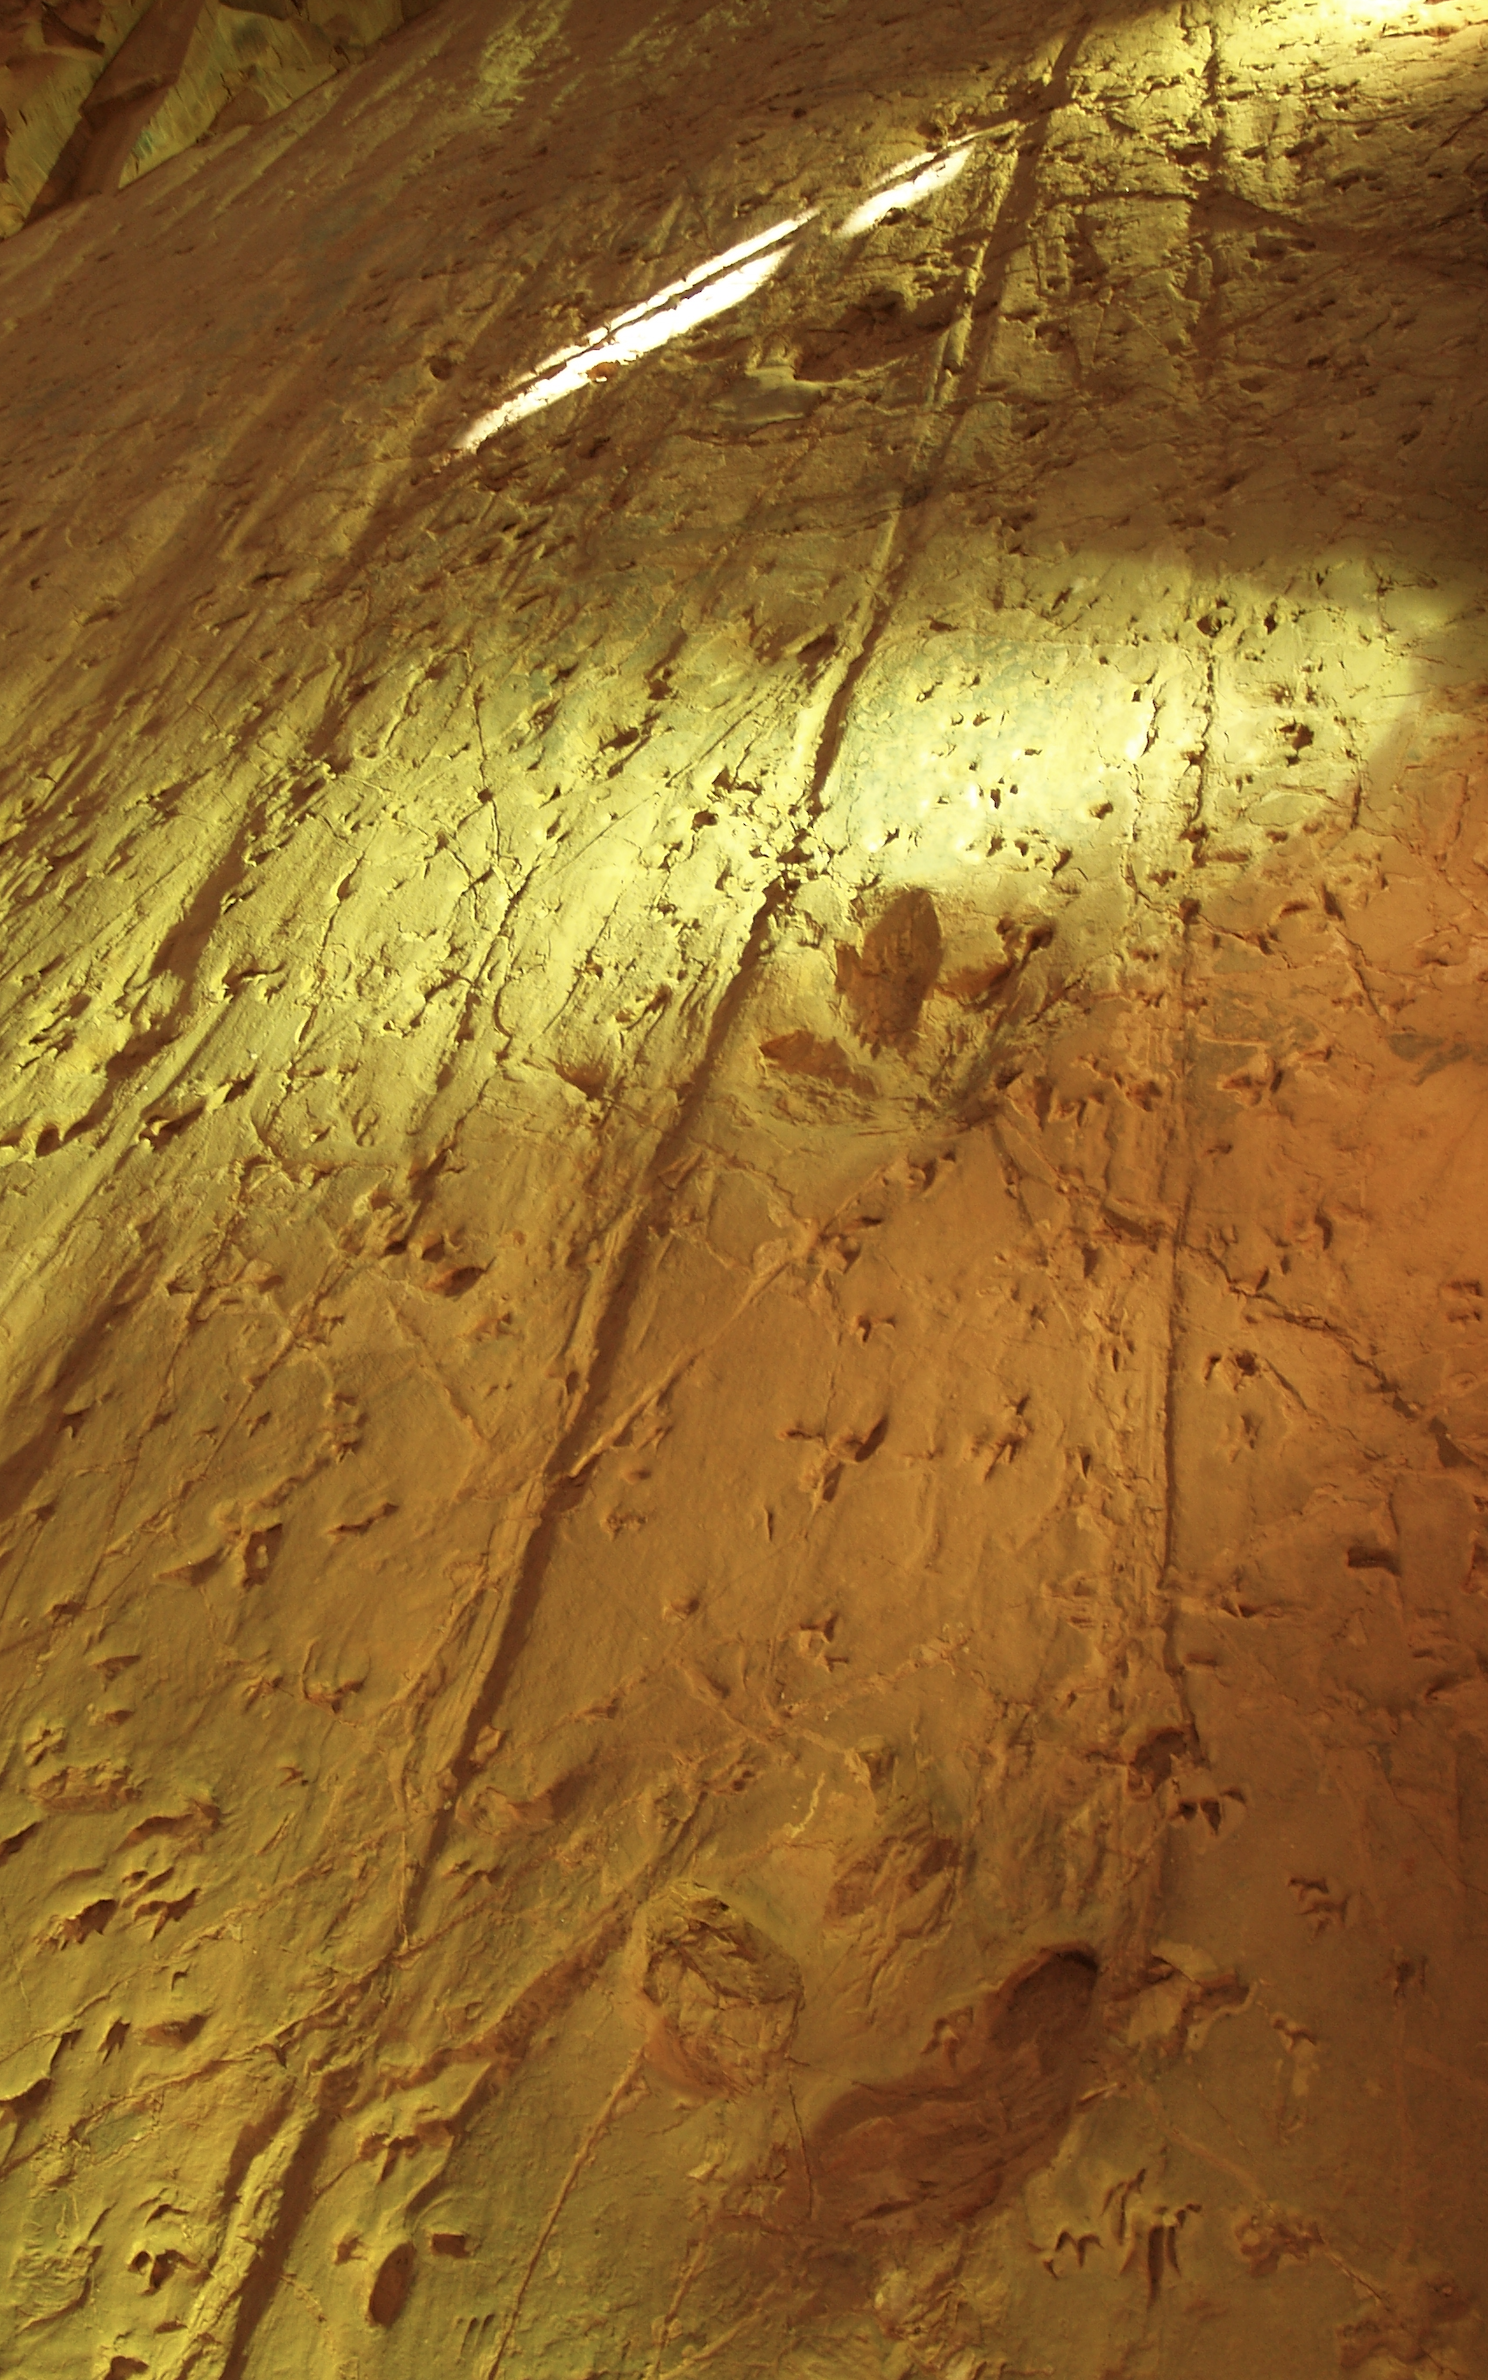
The large tracks at Lark Quarry, Australia, have been something of a source of controversy. When first described by Thulborn and Wade, they were interpreted as having been made by a large theropod. The site was interpreted as evidence of a dinosaur stampede, because running counter to those large tracks are hundreds of smaller tracks running in the opposite direction (in fact, BBC/Nat Geo made a documentary about this in which I appear).
But then in 2013, Romillio et al reinterpreted the track maker to be an ornithopod; an iguanodontid or such. They used morphometrics on the tracks.
This was rebuffed by Thulborn very shortly after, who disputed Romillio et al’s claims about track maker, and pointed out that even if it were an ornithopod, the large number of small animals all moving in the same direction still meant it was a stampede, so the central thesis isn’t necessarily wrong.
Romillio and Salisbury hit back in 2014, with a second study that used 3D scans to support their original claims.
I stuck my oar in, with a book chapter about using objective methods on subjective outlines, which came out in 2016, in which I applied Romillion et al’s morphometrics but to a series of outlines derrived from different depths in a single lark quarry track – showing that as you approached the base of the track (ostensibly where the foot-sediment interface more closely matches the foot), their own methods started indicating a theropod origin.
…Anyway… the point is, these tracks are argued over as to whether they are ornithopod or theropod. So they could be a great test for our neural network.
And the result was… messy.
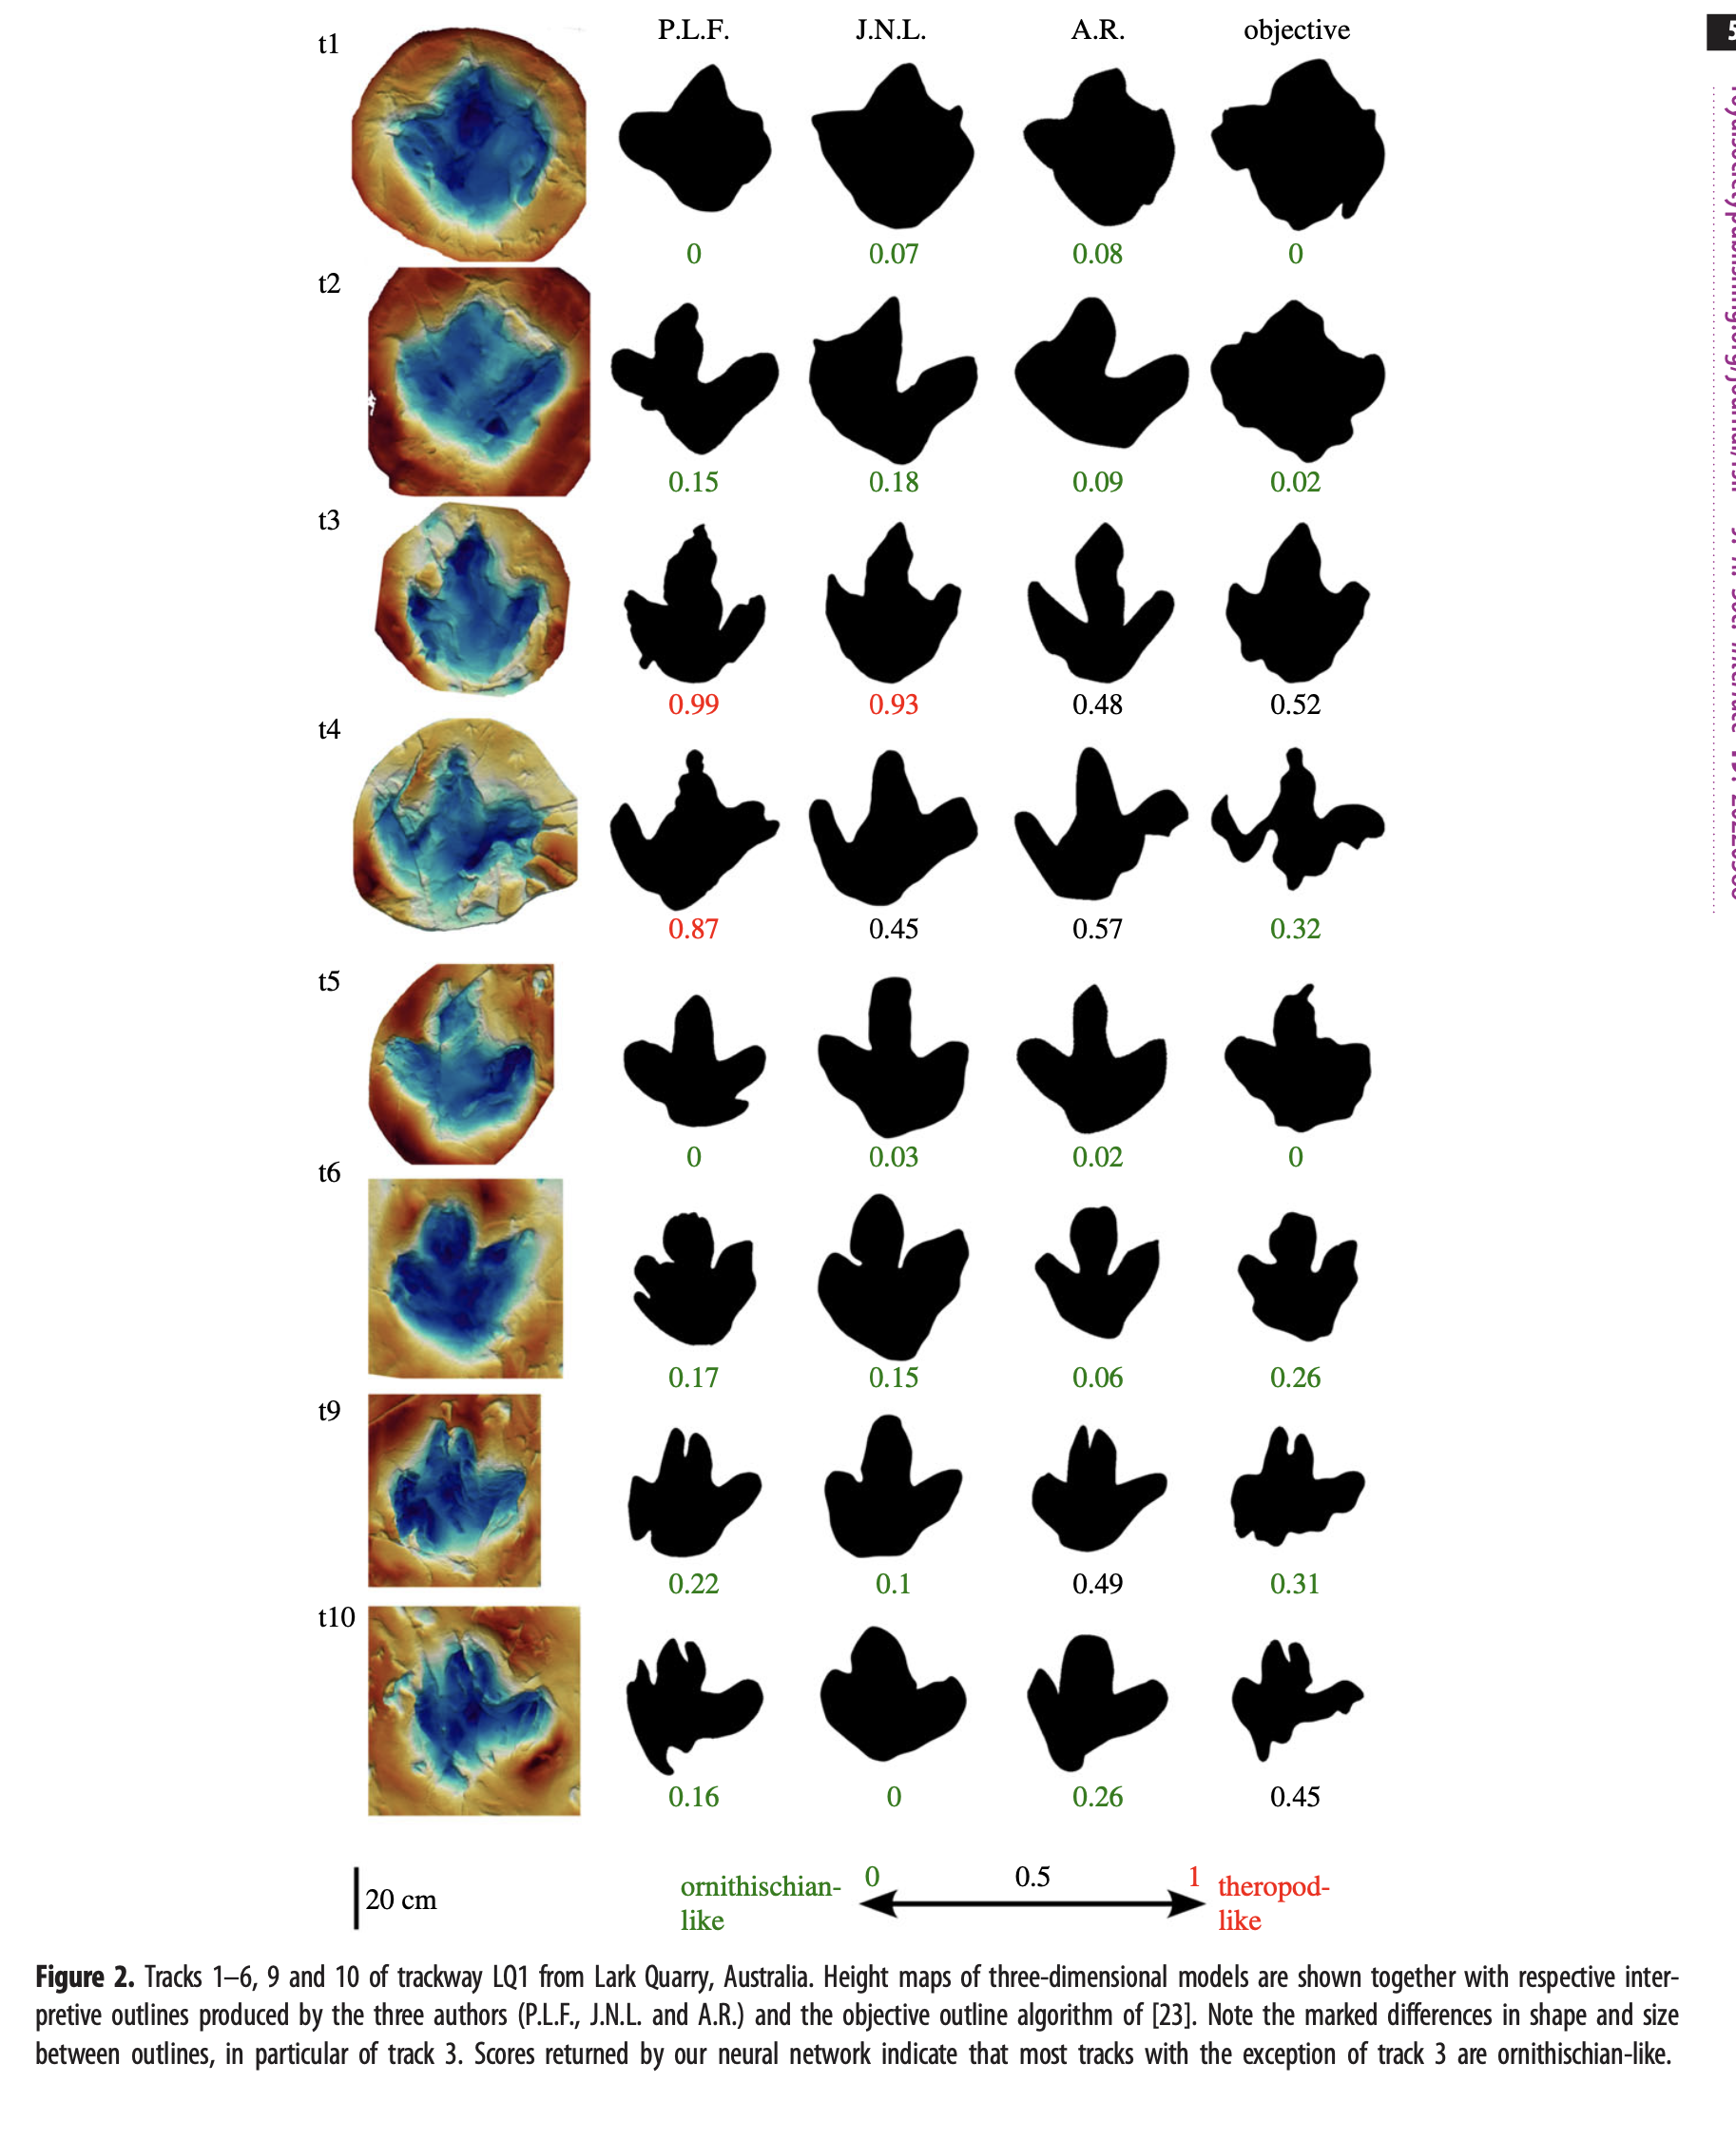
Above is the figure from Lallensack et al 2022, and shows on the left, the 3D models of the large Lark Quarry tracks (these form a trackway, from t1 to t10 – 7 and 8 are missing as they are deemed too distorted). We then each drew outlines based on these 3D models, eye-balling it, and produced outlines using Jens’ objective methods. Then we gave our outlines/silhouettes to the neural network. Scores under each silhouette are the neural network’s score, where lower is more ornithopod, and higher is more theropod like.
Straight away, it’s interesting to note how our own biases come in. Despite trying to be objective, I clearly have a more theropod bias for these tracks, generally scoring higher than my co-authors. Meanwhile, Anthony clearly has a more ornithopod bias, generally getting lower scores. Jens, who has no horse in this race, and the objective outlines, tend to waver around a bit more.
And we’re still left with interpretation being a major part of this. Looking at the 3D models above, I’d hope you’d agree that track 3 looks by far the least messy, and indeed this is the track that is generally considered the least distorted, and most closely matching the track maker’s foot. Jens and I both created outlines that were very theropod. Anthony’s outline was considered ambiguous or slightly ornithopod by the neural network, while the objective outline, based on curvature of the sides, came out slightly theropod.
So, once again, even with objective methods, and a neural network involved, we still end up with a system where interpretation matters. In fact, the press releases put out by Anthony and Queensland University were very naughty – they all proclaimed headlines that we’d show the trackmaker was an ornithopod, which is patently not the case. If anything, the data above show that the highest fidelity track (remember, not “best preserved”!) is very theropod-like, and that the others deviate from this due to formational variation. I would still make the case, as I did in my book chapter, that Jens’ ‘objective’ outline is not representing the foot particularly well, because the sides of the track are quite sloped. Indeed, our paper itself states:
“…the mean of scores of all considered tracks is not necessarily an informative measure, as in many cases only one or few tracks will convey the anatomy of the foot accurately…. …As in the case of Lark Quarry, the identification of the trackway will ultimately depend on the question which of these tracks does more closely match the trackmaker’s foot, which cannot be fully addressed without careful restudy of the tracks, or three-dimensional models thereof.”
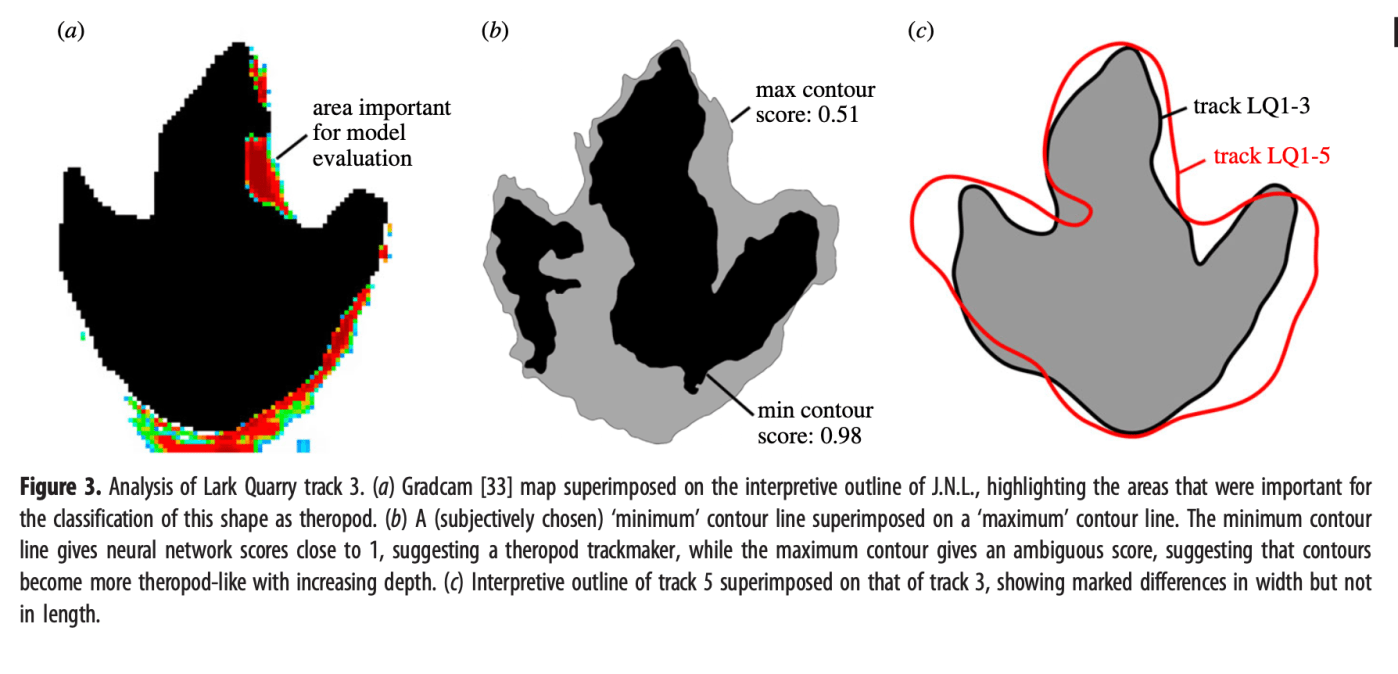
We took a closer look at that track 3, and saw the same thing with the neural network that I reported with morphometrics in 2016 – that the deeper you go, the more theropod-like the track becomes:

This is a research area Jens is going to be heading off into, hopefully really advancing it further, and with a bit of luck, incorporating 3D data as it becomes more widely collected. For now though, the above clearly demonstrates that even if the algorithms can perform better than the experts in specific cases, we’re still needed to interpret the AI’s output! I’ve glossed over a lot here (like how we trained the model, what model was used, how we used older replicas of the lark quarry tracks that were less damaged, etc), so if you want a deep dive, make sure to go read the paper (if you need access, contact me and I can send a PDF):

paper available here – via Google Scholar …
https://researchonline.ljmu.ac.uk/id/eprint/18087/1
The unformatted versions UKRI force us to upload are rubbish. We have put it up on researchgate though: https://www.researchgate.net/publication/365284947_A_machine_learning_approach_for_the_discrimination_of_theropod_and_ornithischian_dinosaur_tracks