I should probably have made this post sooner, as it’s about my chapter in the Great Dinosaur Track Book Of 2016: “Dinosaur Tracks: The Next Steps”. It’s a volume I was privileged enough to be an editor for, and it contains a number of excellent chapters.
I wanted to post about my own chapter in there – Applying Objective Methods to Subjective Track Outlines. In it, I try to make the case that measurements of tracks can be somewhat subjective, and because of this, application of objective methods can be misleading.
Ichnology has traditionally relied on 2D outlines of footprints – It had to, for many years paper was the only medium authors could communicate research with, and for a long time it was difficult to print photographs in a meaningful way. The trouble is, outlines are interpretive.
For instance, let’s take a single dimension – length, and ask ourselves how long a track is. You’d think it were simple and have little room for error. But take a look at these ways in which tracks can be (and have in the literature been) measured:
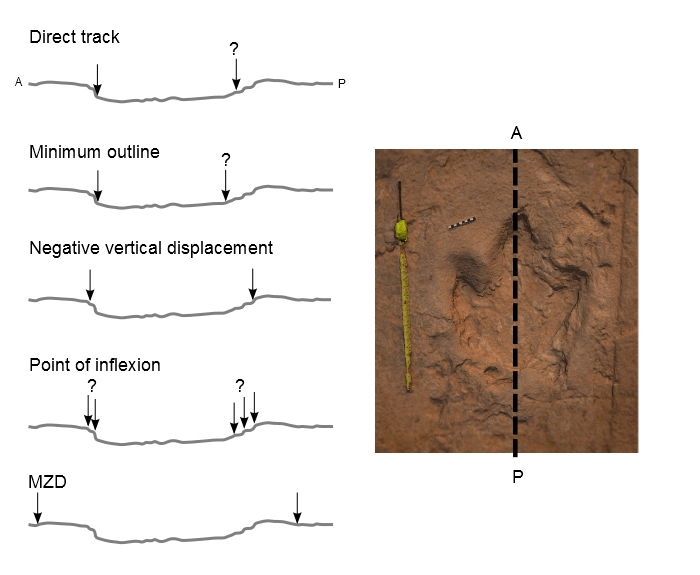
Measuring a track isn’t like measuring a bone; there is rarely a distinct beginning and end.
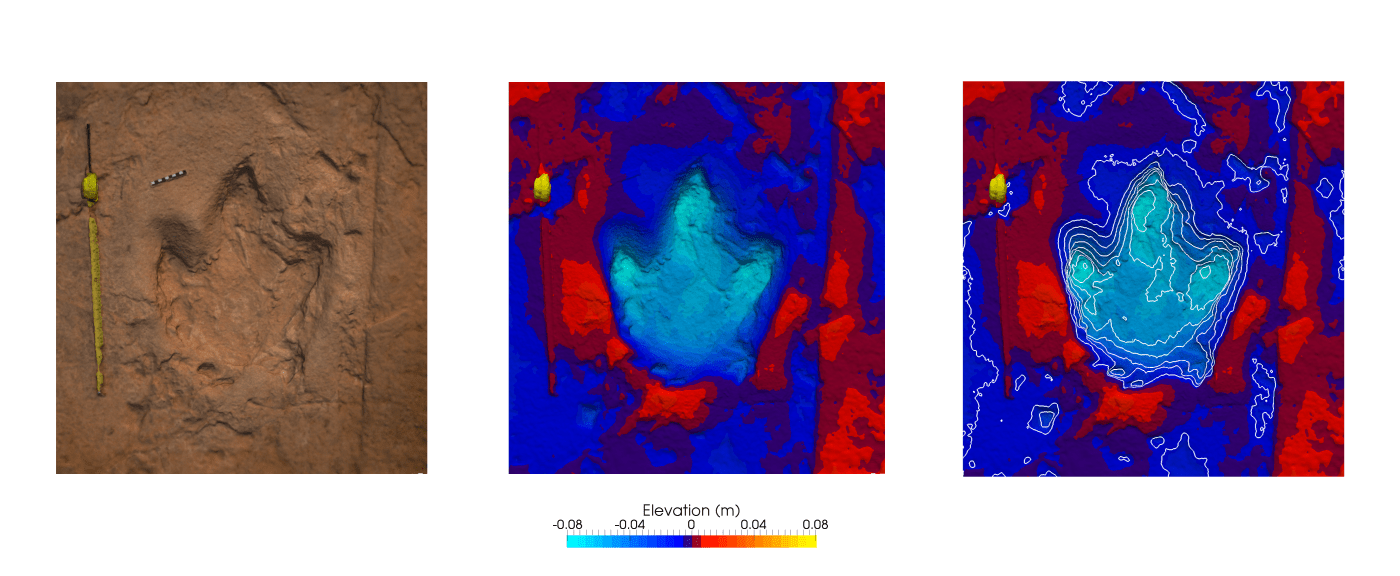
So to illustrate this problem, I took a 3D model of a track from Lark Quarry, Australia, aligned the surrounding undisturbed sediment to the horizontal, and defined a series of outlines based on depth:
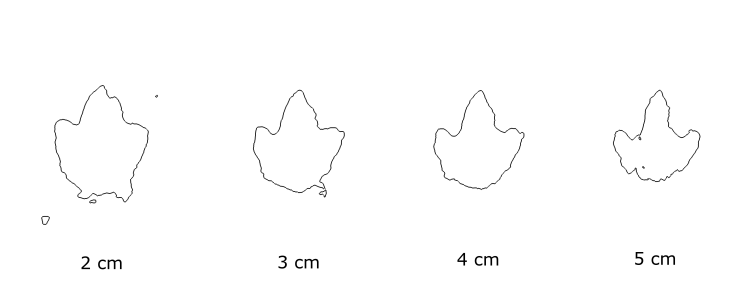
I’m sure you can see the considerable shape change. To give you some context, here’s the track phototextured, height mapped, and contoured:

‘Why does this matter?’ I hear you ask. Well, because based on where you draw the outline (and thus define such features as length and width) you get very different measurements.
I used this track because a) I happened to have 3D data of it, and b) Romilio and Salisbury (2011) used it to apply multivariate analysis and determine that the track maker was ornithopod. I was able to run the same analysis on each of the outlines produced. What I found was that as you went ‘deeper’ into the track, the multivariate analysis moved more and more toward a theropod trackmaker.
Was it a theropod track maker, or an ornithopod? For the purposes of this study it doesn’t really matter. The point I was trying to make was that the conclusions change depending on how an outline is drawn.
It might be tempting to assume that if you’re using an objective, numerical method, then your results will also be objective. Except of course, that isn’t the case if your input data are subjective.
This is why it is imperative that people document as much as they can in 3D – why it’s so important palaeontologists, and scientists more generally, make the most of the technologies around us, and subsequently share that 3D data.
The full reference for this chapter is:
Falkingham, P. L. (2016). Applying Objective Methods to Subjective Track Outlines. In P. L. Falkingham, D. Marty, & A. Richter (Eds.), Dinosaur Tracks: The Next Steps (pp. 72-81). Bloomington: Indiana University Press.

Leave a comment